Adopting an Open Source Software project
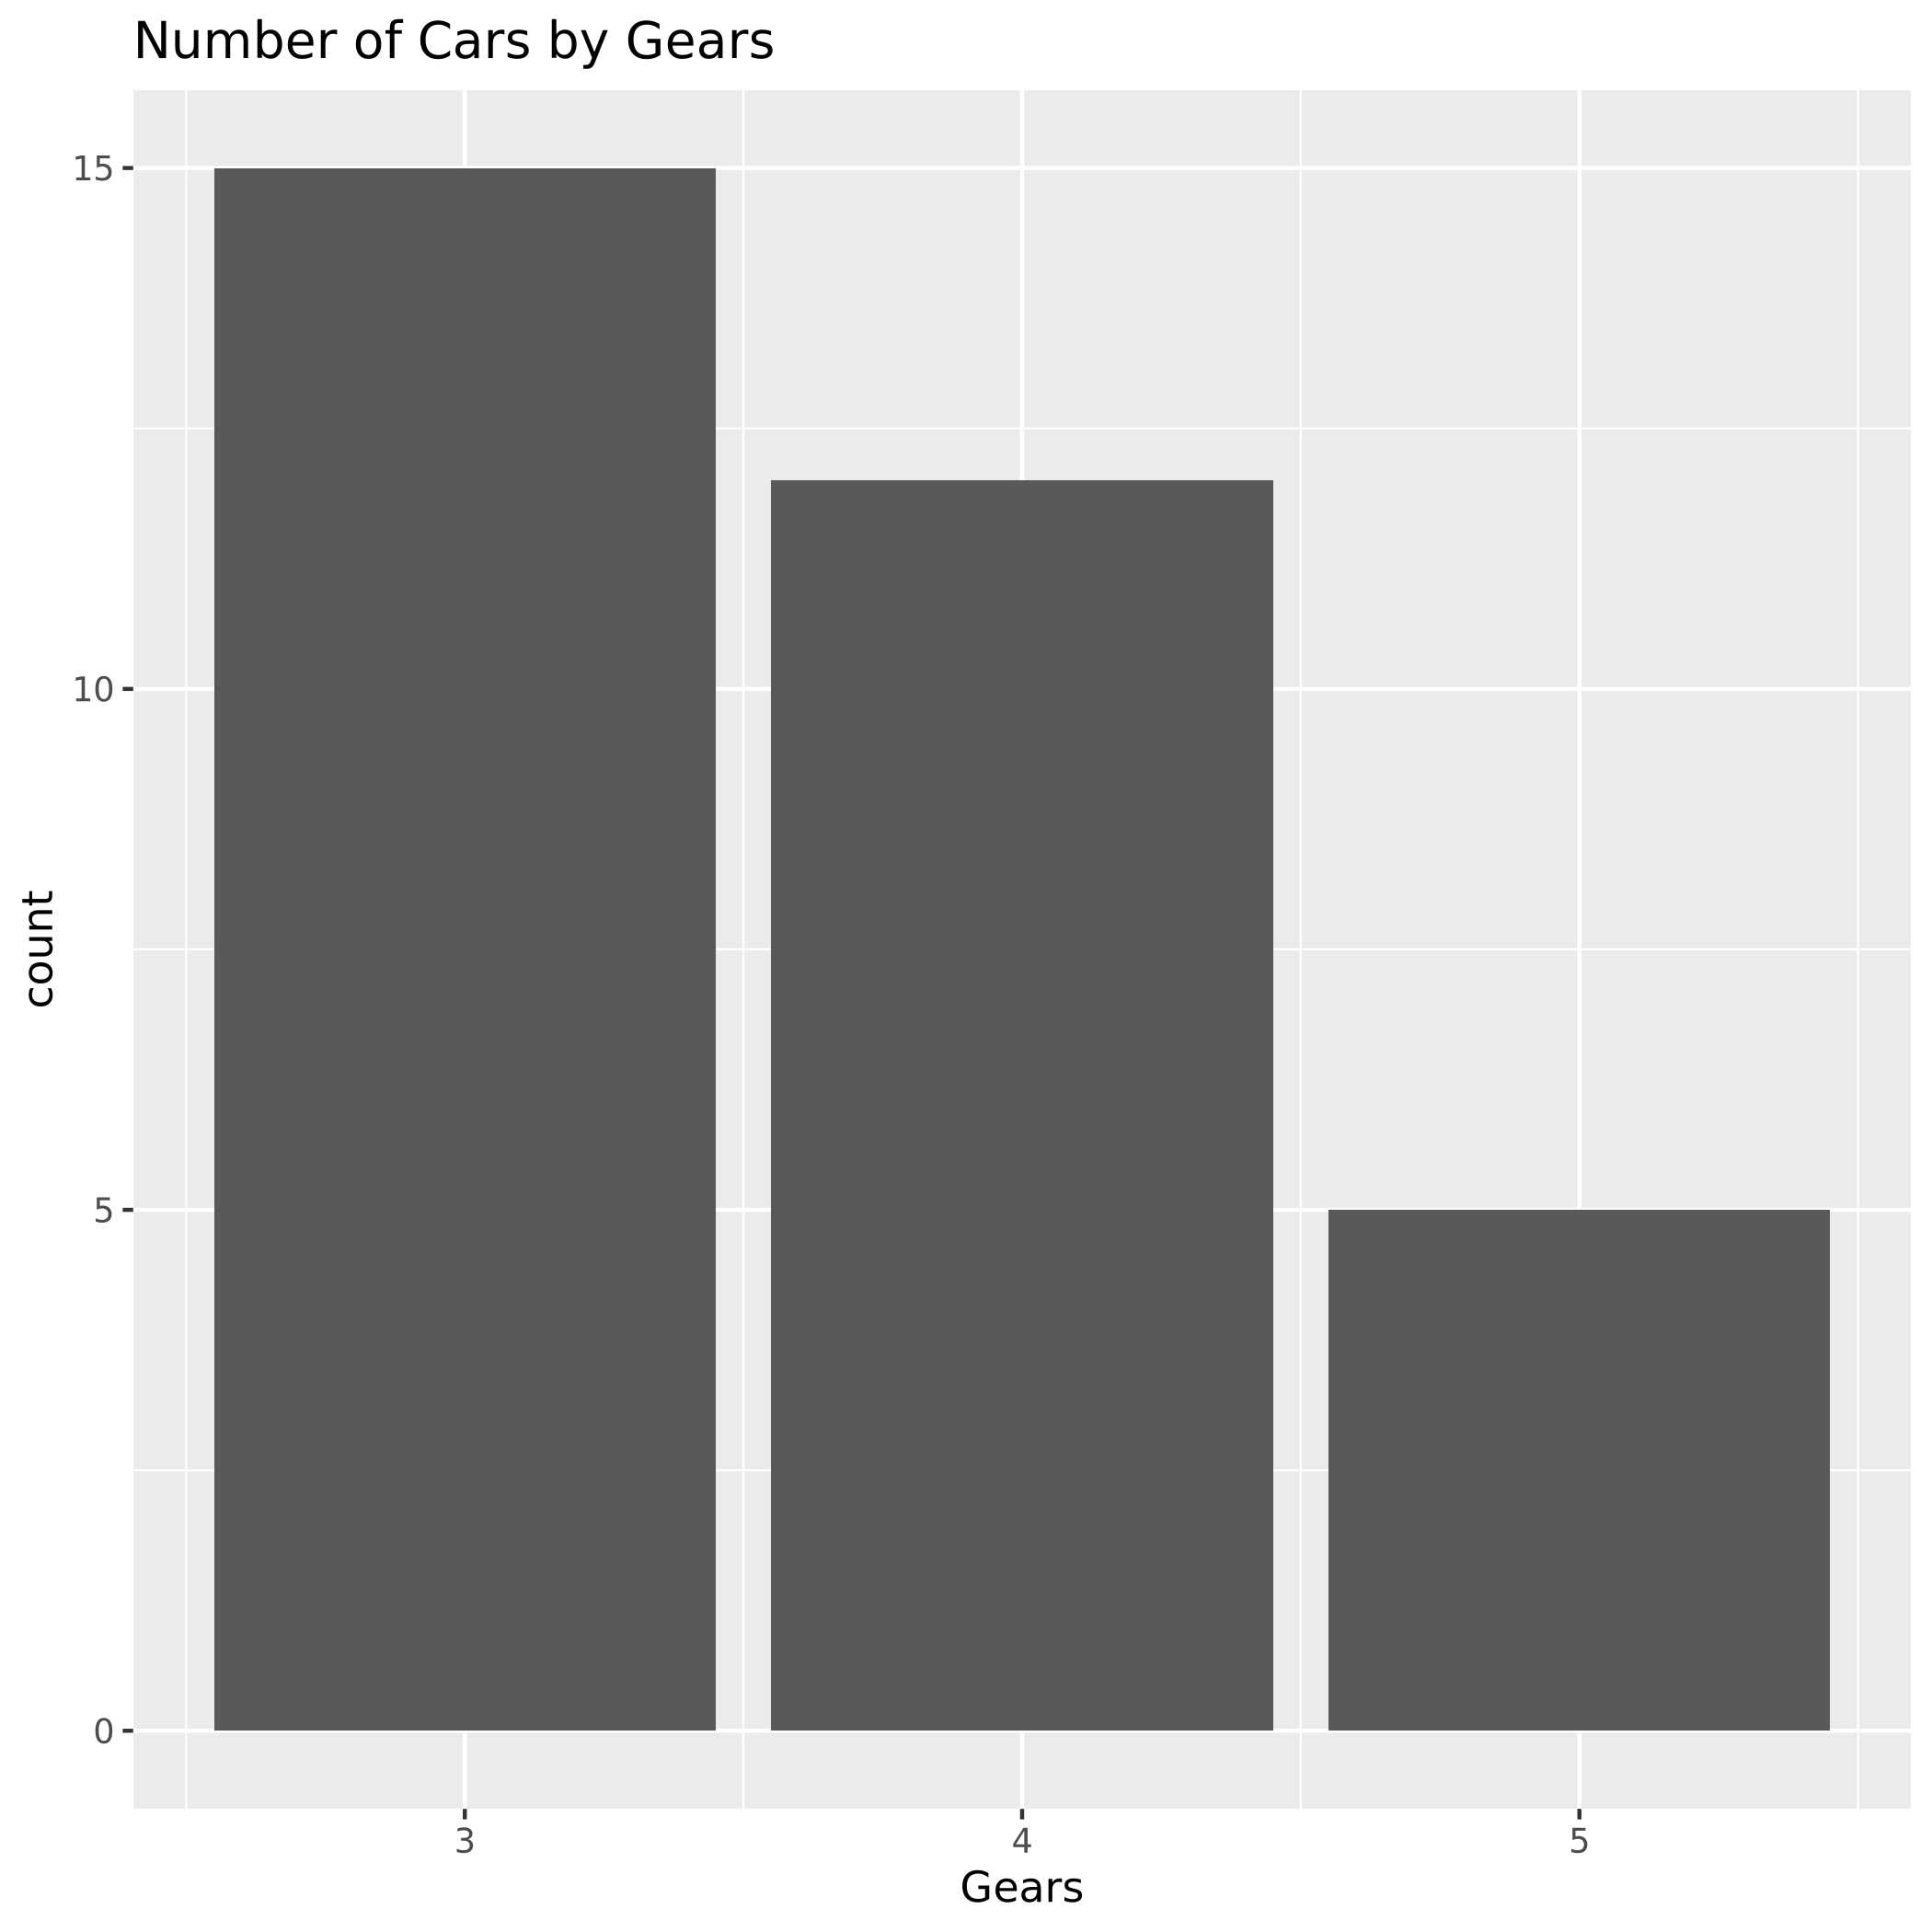
A few days ago, I needed to produce some bar plots. However, the distribution of the data I was working with was much higher on one side of the plot while the other had very low numbers. Plus, on the end with lower frequencies, it was very hard to spot the differences between frequencies lower than 10.
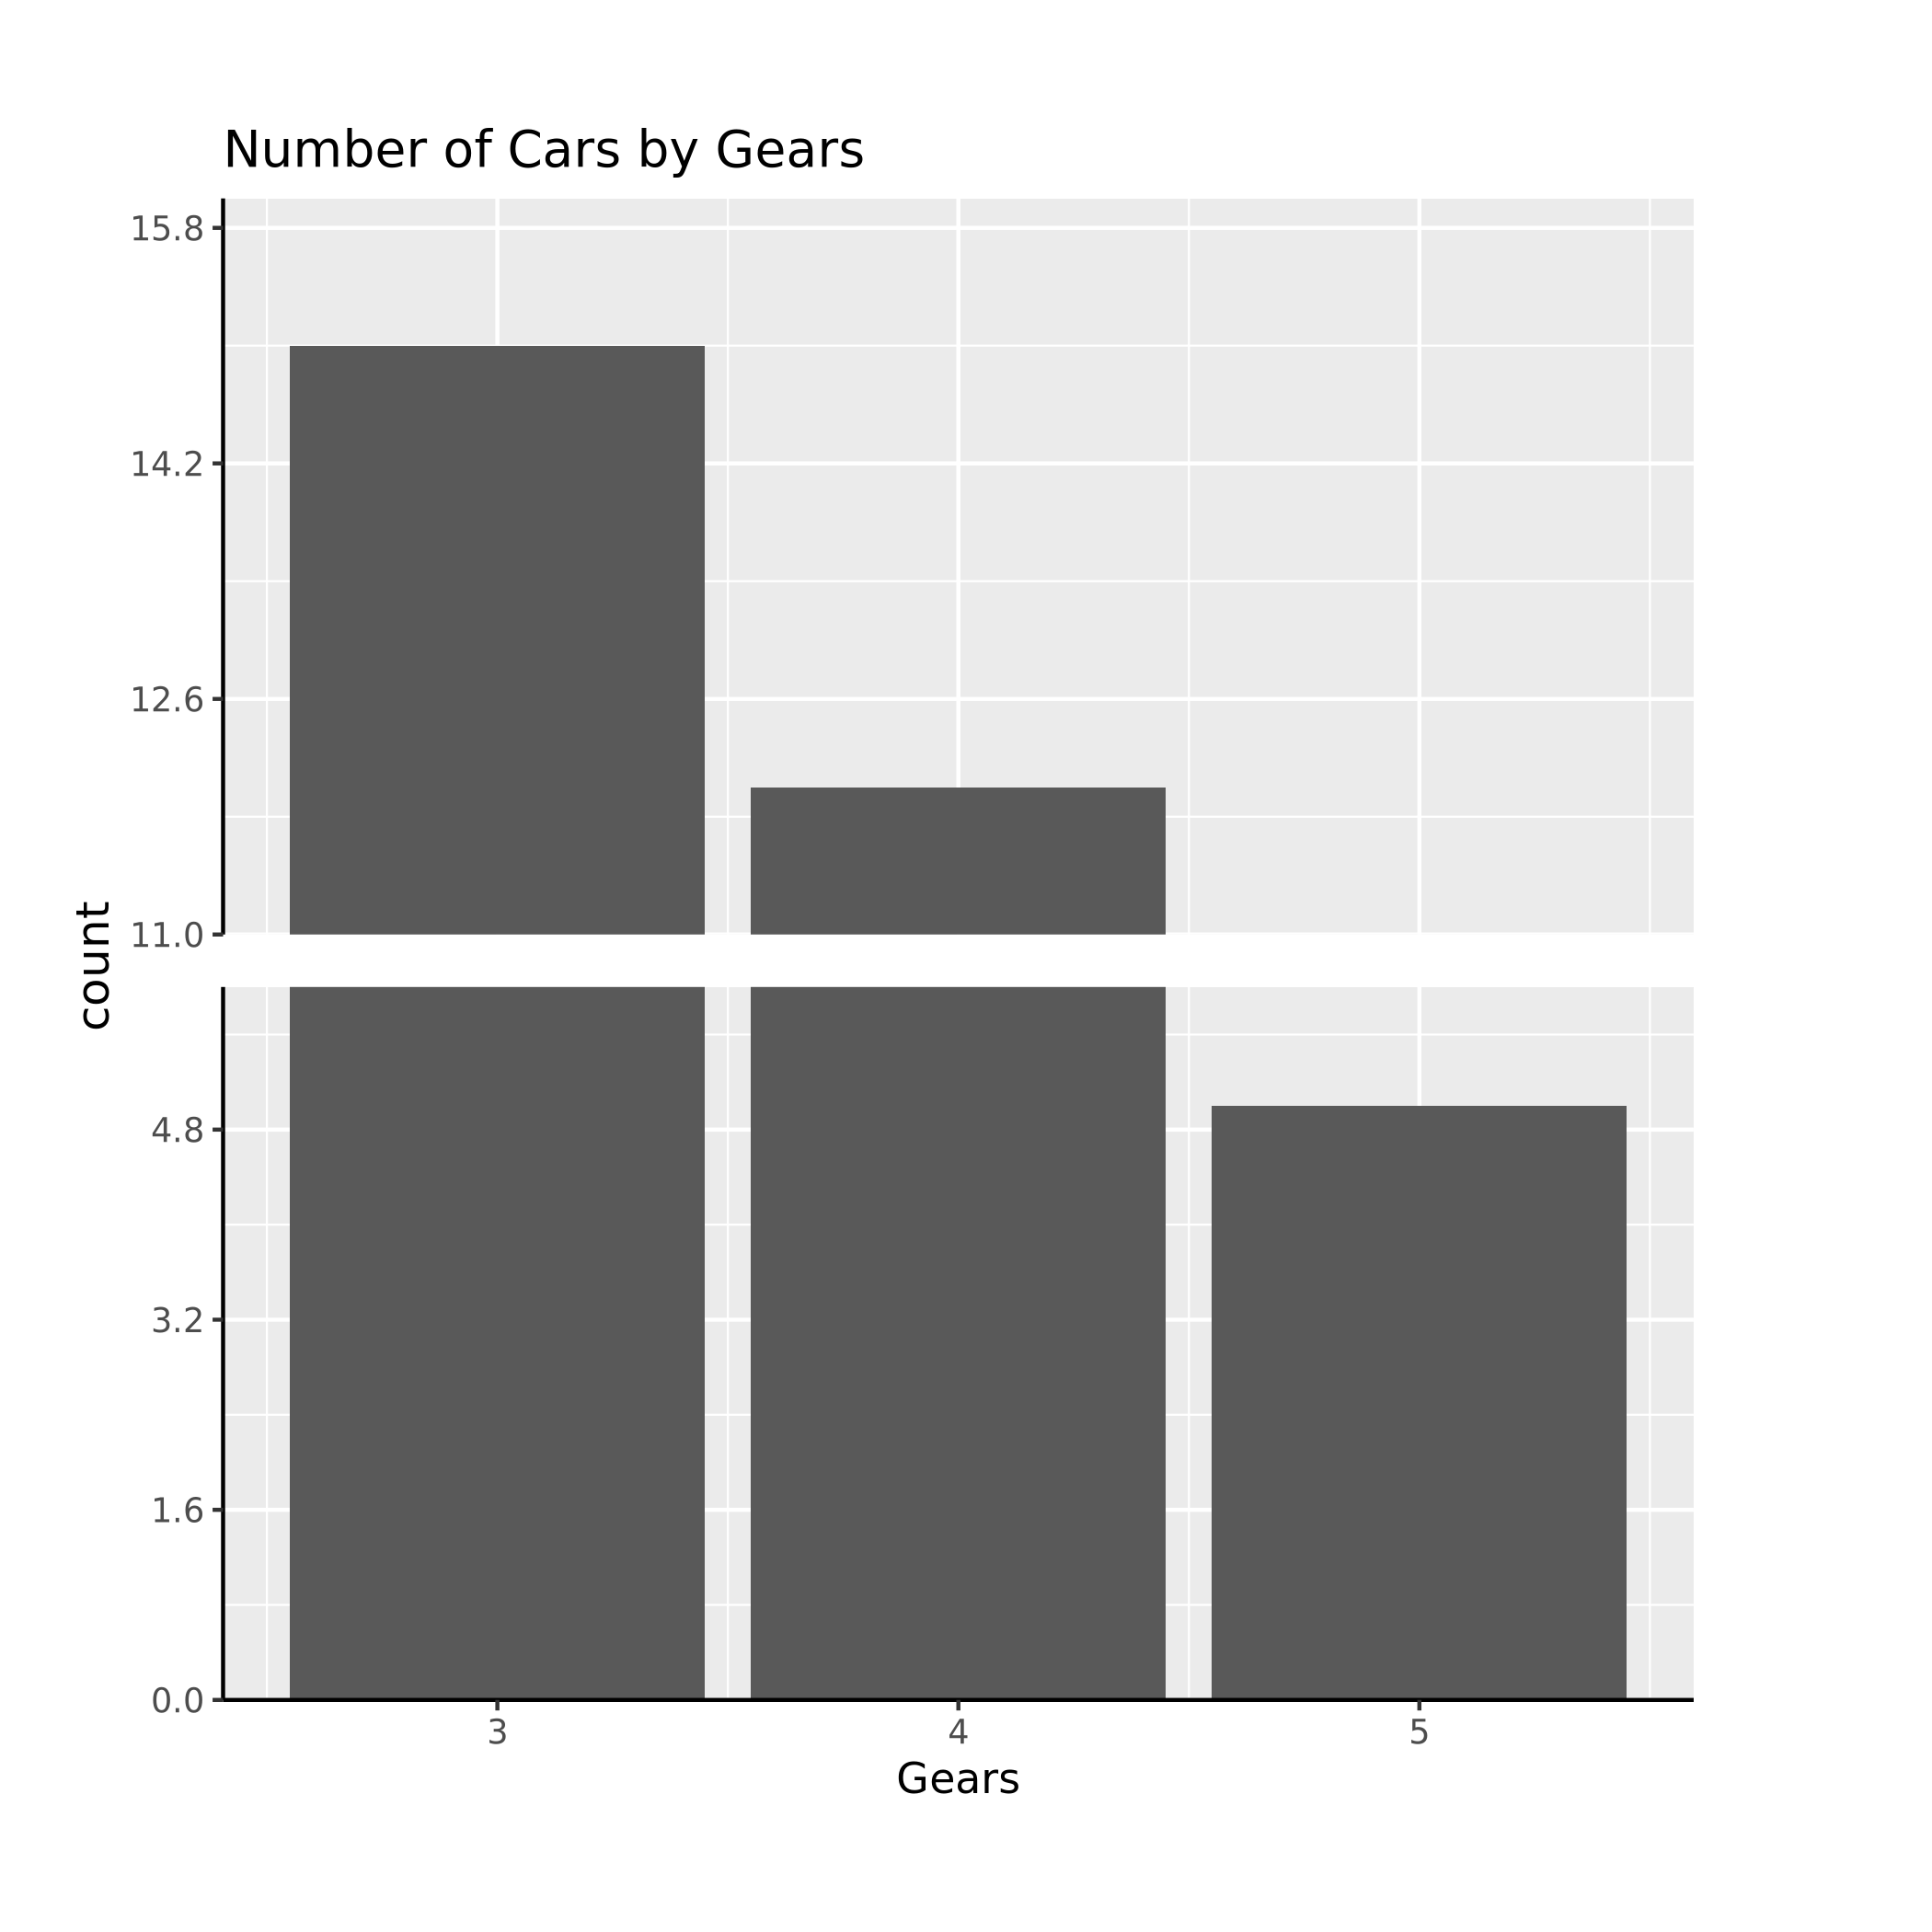
My supervisors suggested splitting the vertical axis and skipping part of the larger bars to bring both ends of the higher and lower frequency bars closer together. The suggestion made sense but I was not sure how I was going to split those plots programmatically. Bear in mind, this was just a couple of days after starting using R for plotting.
Alright, but, why was I using R in the first place?
Well, a few days earlier I was happily immersed in the Python stack for all my plotting needs. More specifically, I was using holoviews with the bokeh back end. I found this solution was simplifying my analytics pipelines while making it easy to produce interactive graphs in the Jupyter lab. All was good! Until… My progress was stopped by a bug with no known solution yet. This bug crashes the plotting application whenever an offset on the y-axis of the label is specified. Therefore, I needed to adapt. Firstly, I tried to work around it by changing to the matplotlib back end. The results were slightly better. At least something was being plot. Although, the error bars and labels were failing to align with their corresponding bars. And the plots produced looked a bit basic or dull.
Therefore, I went searching for alternatives. I was trying to avoid getting into the R programming language. From previous experiences, I felt this language a bit weird compared to what I am used to in Python. But given my current circumstances, I gave it another try. A couple of the packages available were able to produce plots more closely resembling what I needed, these were the core plotting functions and ggplot2 with the last requiring the least involvement for producing more visually appealing plots than the former. The only feature missing was the splitting of the axis.
A few hours later, I stumbled upon the gg.gap package which was designed for doing this specific task on plots produced by the ggplot2 package. I was getting closer to solving my need. Yet again, I found a bug. The gg.gap package was erroneously duplicating the subtitle and the footer of the plots and placing them inside the split it was correctly generating in the plot I was providing. After browsing for solutions, I found other users were having the same problem and the authors had been quiet about the project for a year or so. So, because this package got me the closest to the solution, I decided to try and solve the problem.
To solve the problem I needed to understand the code, but for me, it was being a very difficult task. Yes, I was new-ish to R but the static analyser was calculating a cyclomatic complexity of 67 for the main function. That was not helping my case. Eventually, I had a good grasp of the code and was confident I could solve my problem. Yet, as I was familiarising with the code, I noticed adding features beyond the simple fix I needed would be less daunting after some refactoring. I decided to focus my efforts on applying Clean Code principles and following the tidyverse style guide.
After a few days of work, version 1.0 was ready and it was time to make the package available via CRAN. To do so, I followed the next three guides,
- Fong Chun Chan’s “Making Your First R Package”
- Hilary Parker’s “Writing an R package from scratch”
- Hadley Wickham’s “R packages”
Although I created the package manually, I found the process was not that hard thanks to those guides. (Yet, I had to fix a few errors in the package).
Now, the package can be installed by issuing at the R prompt,
install.packages("gggap")
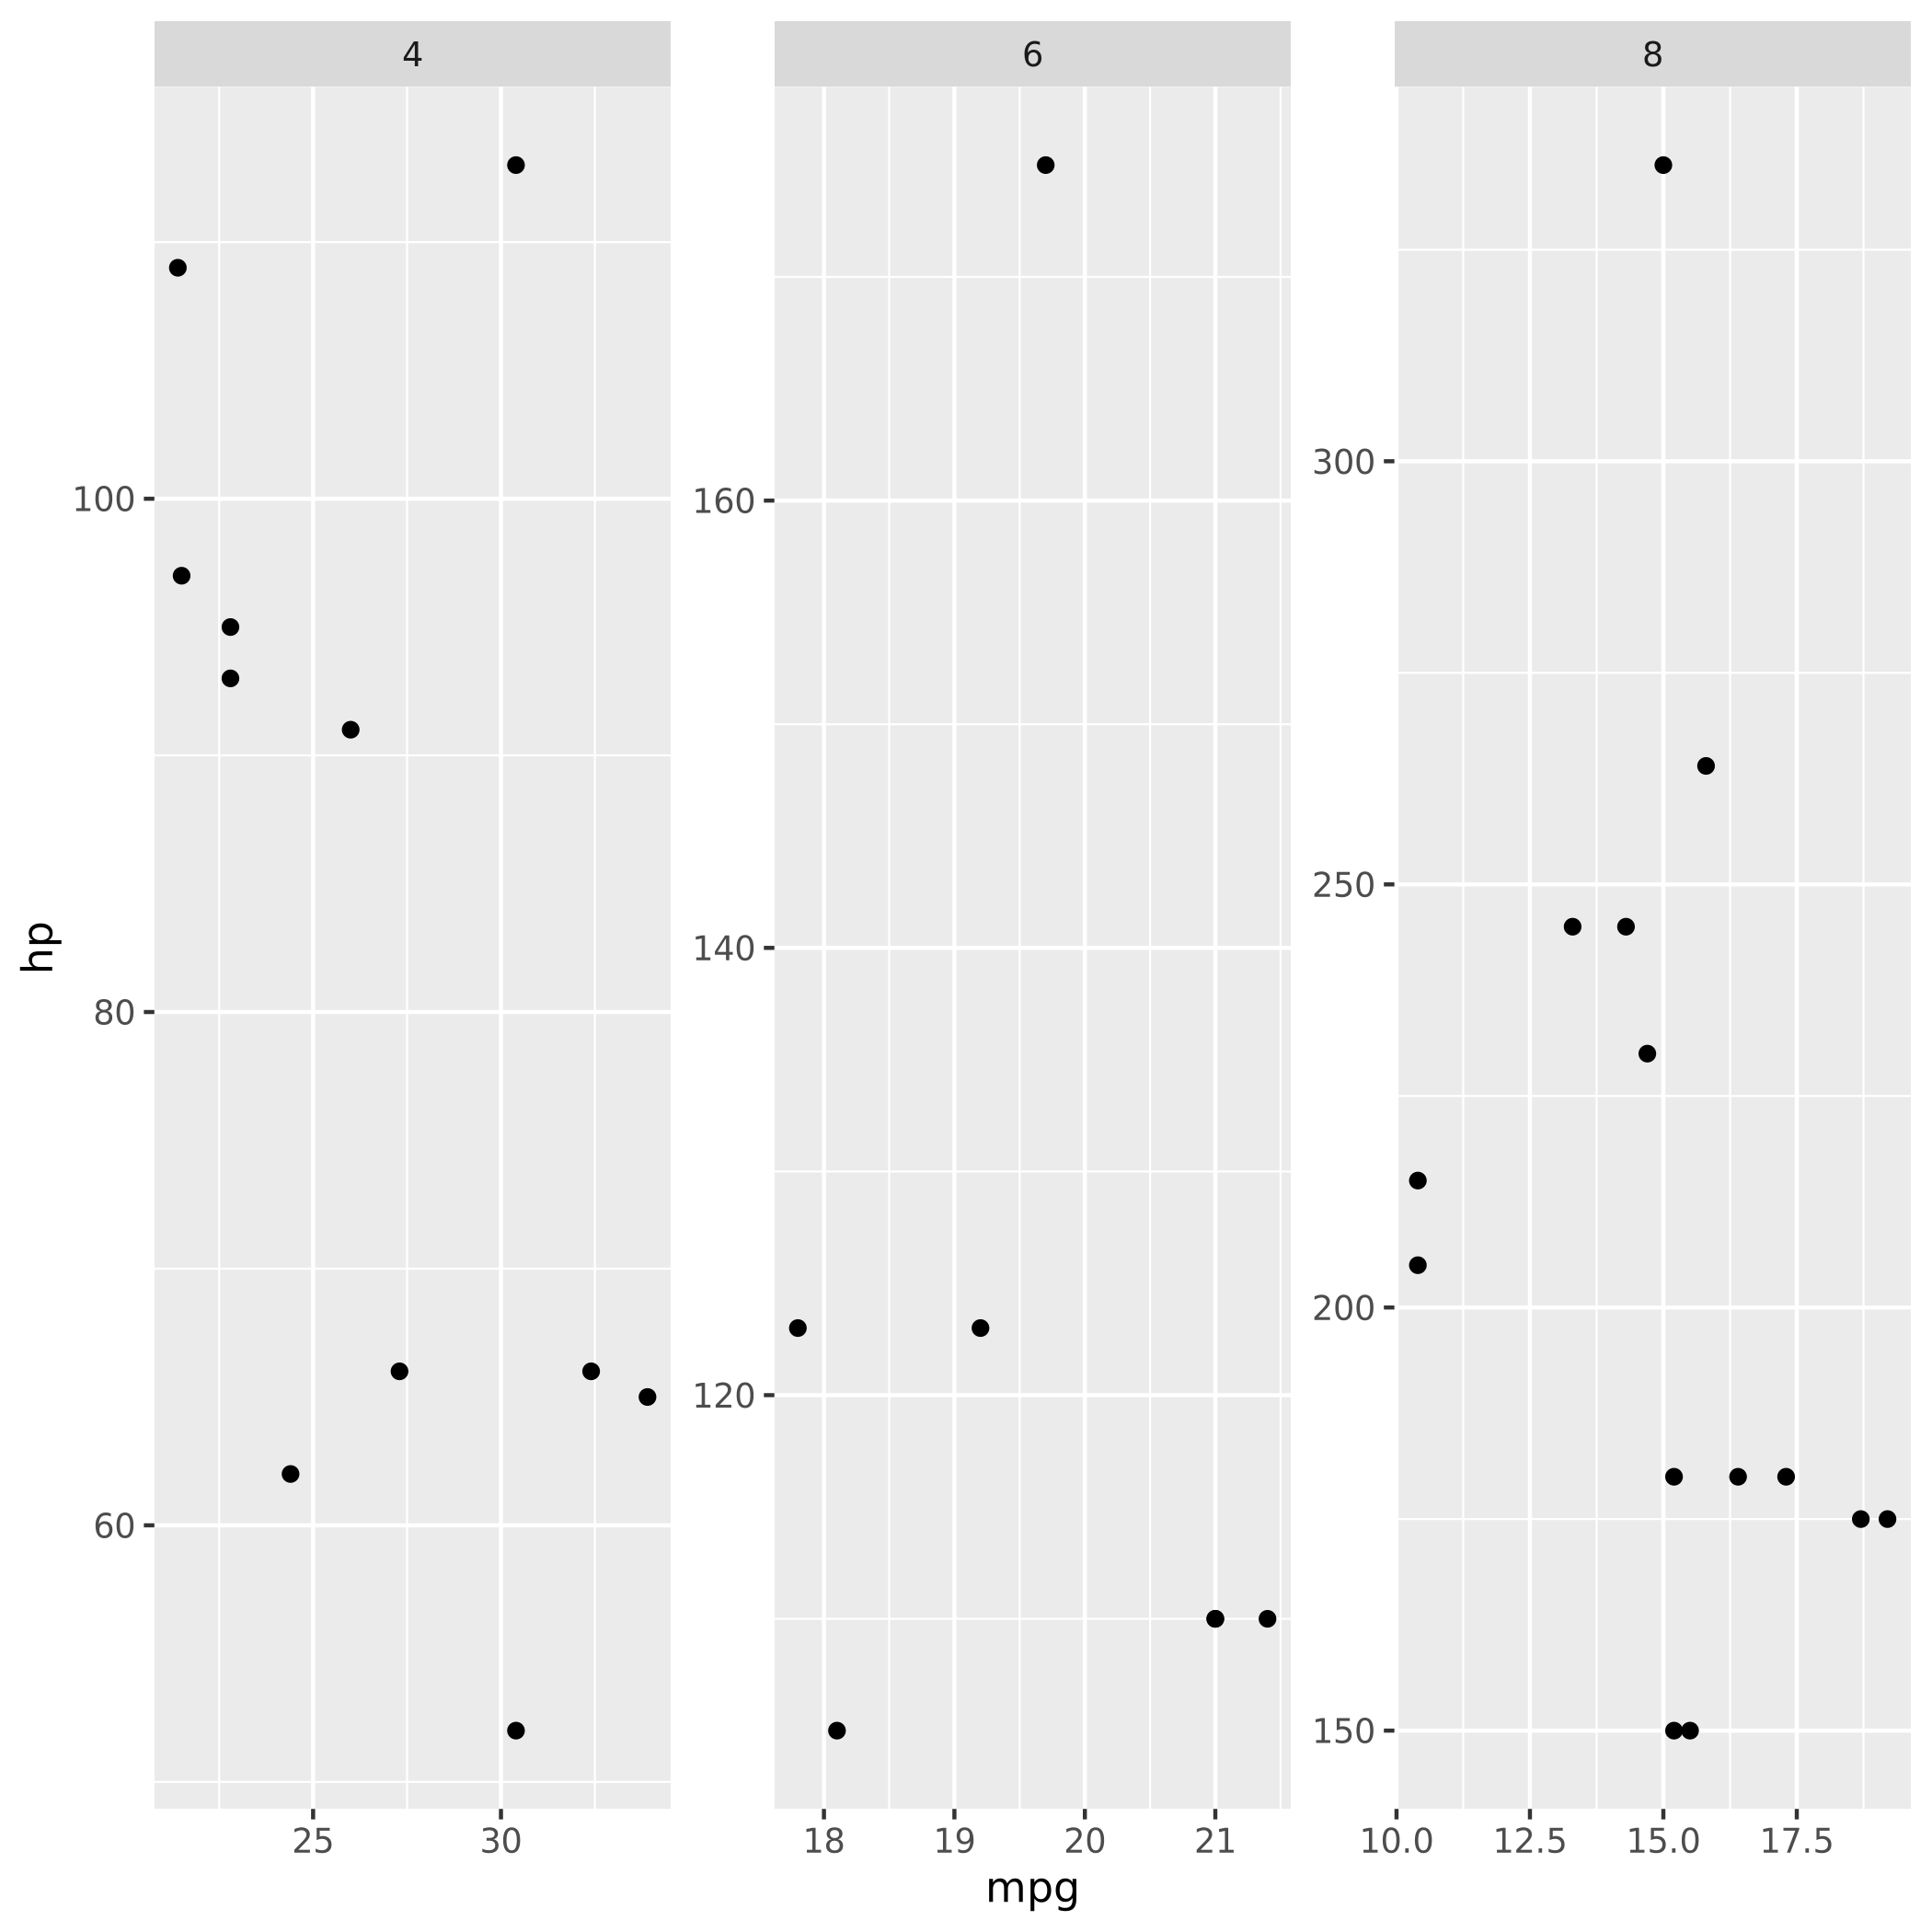
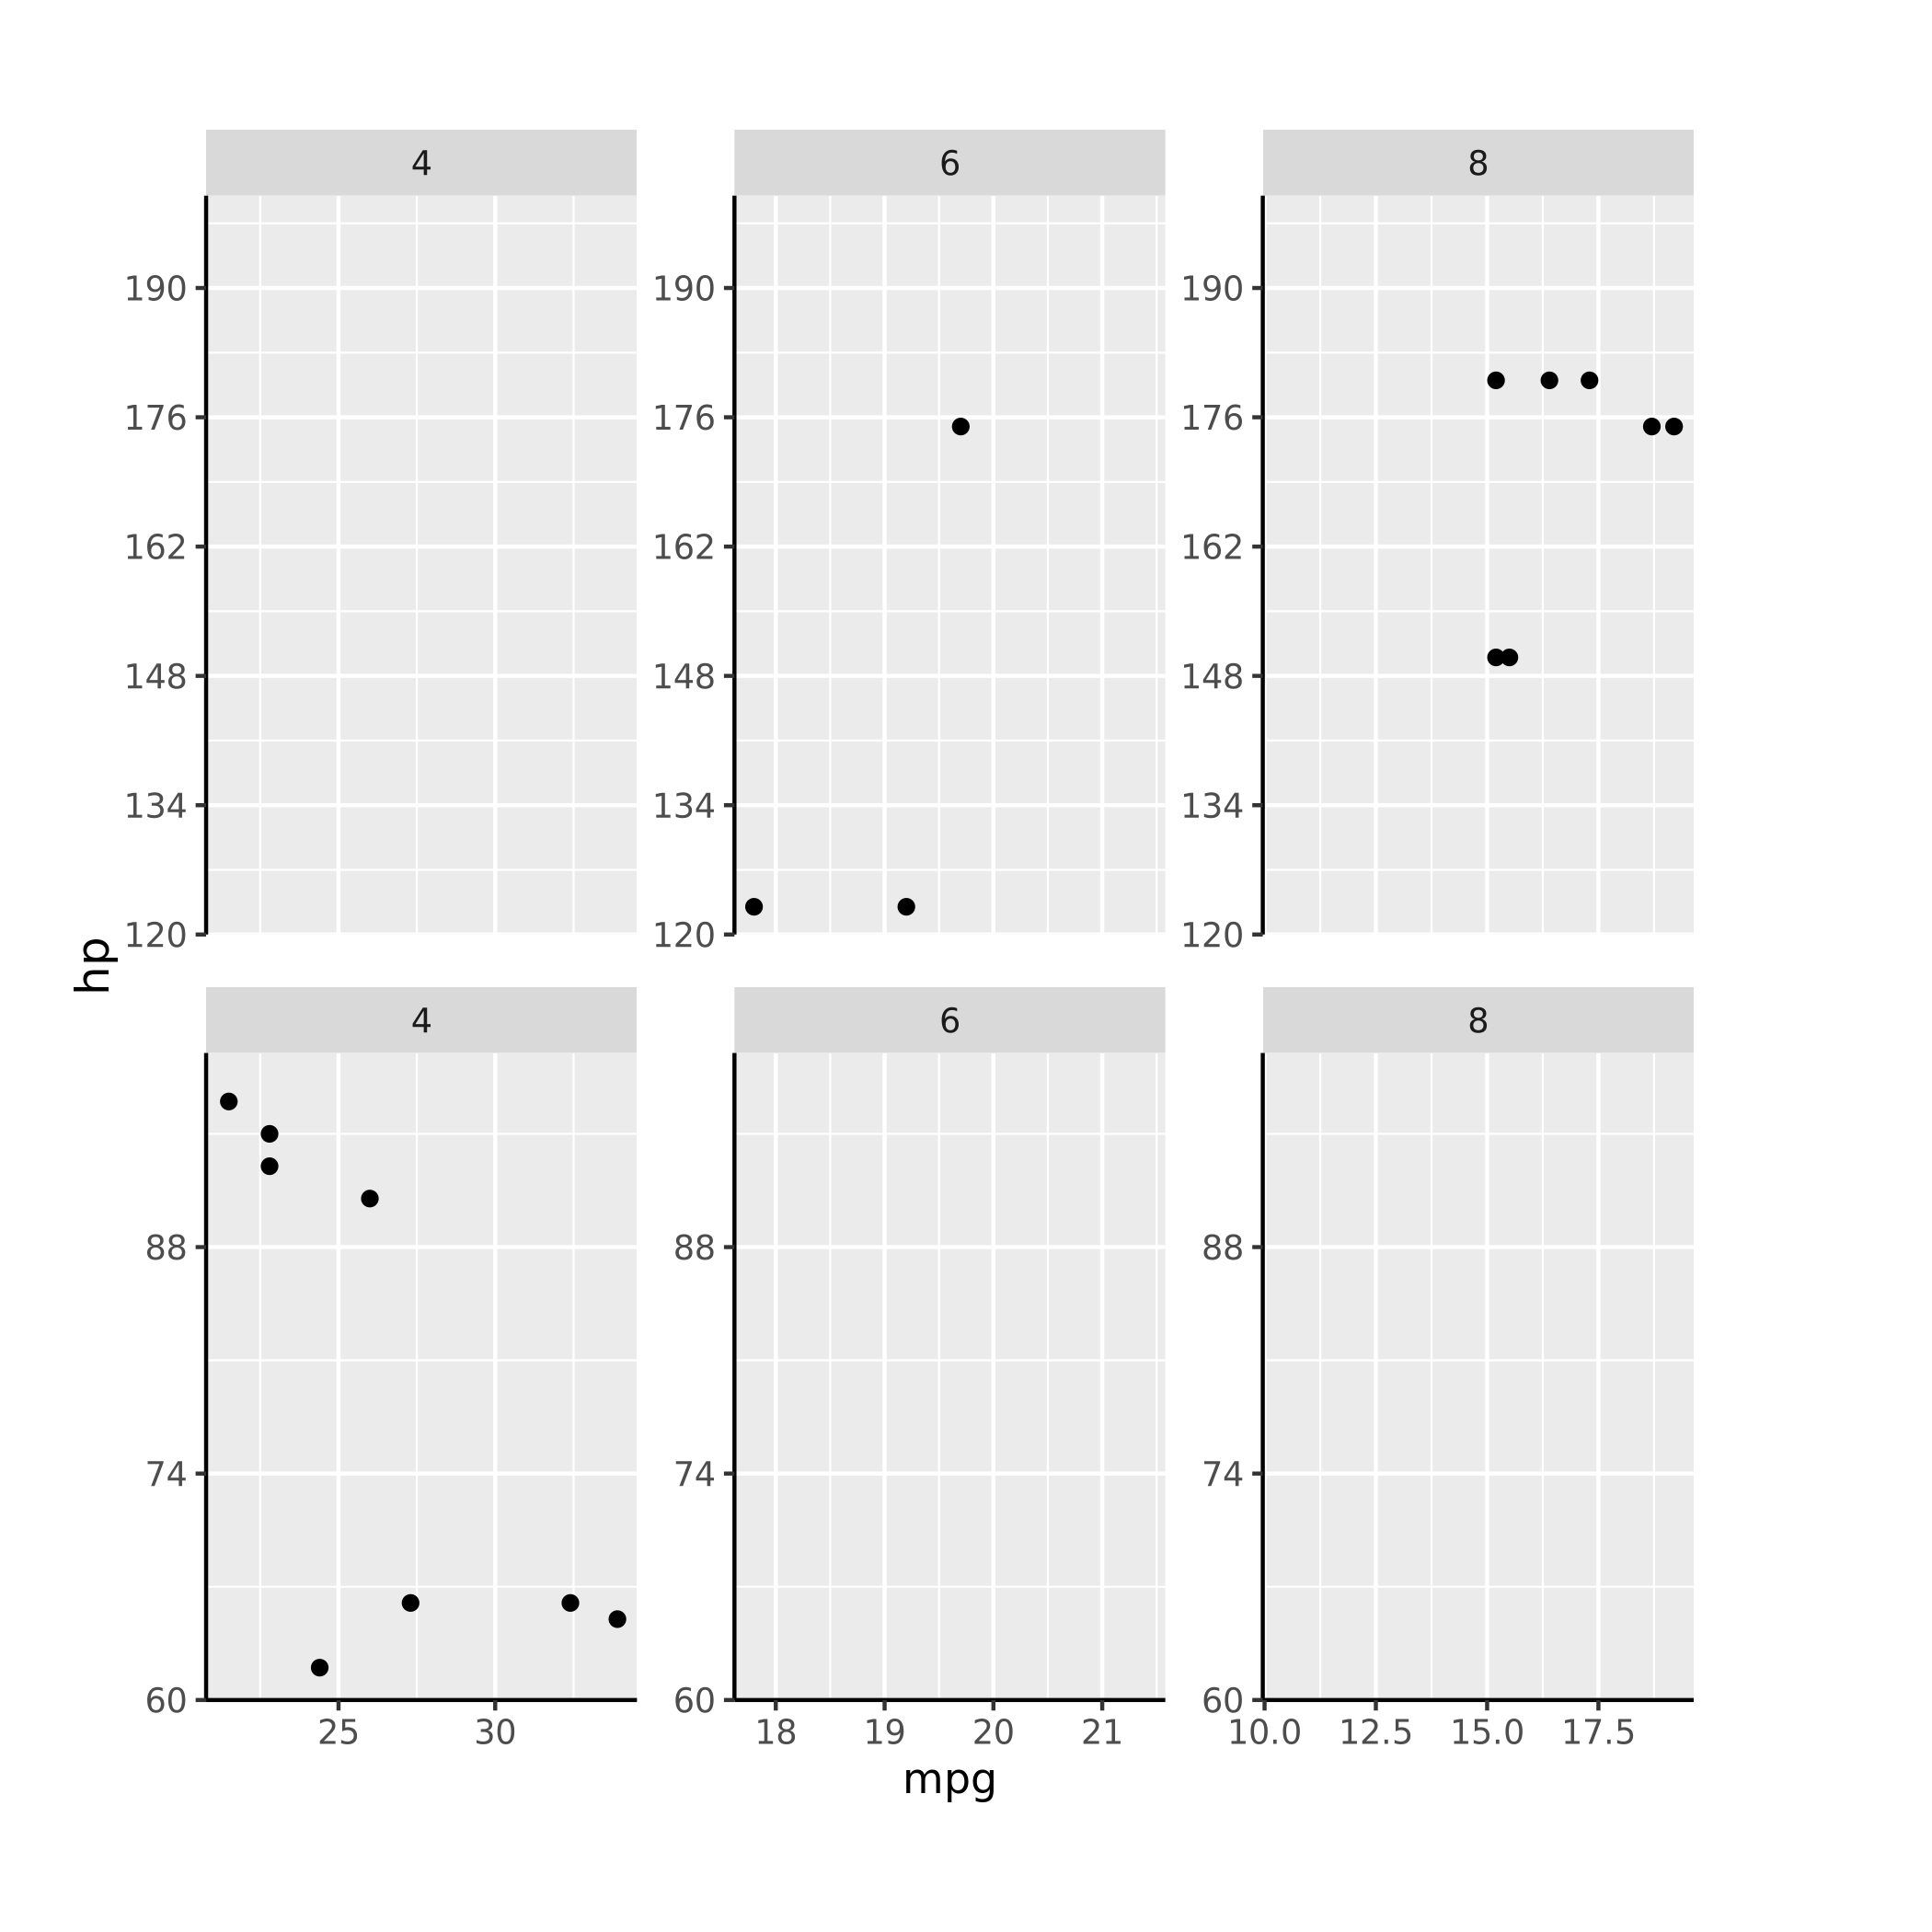
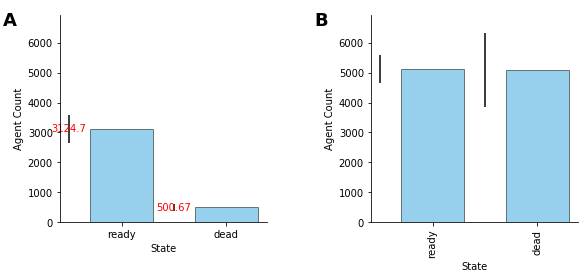
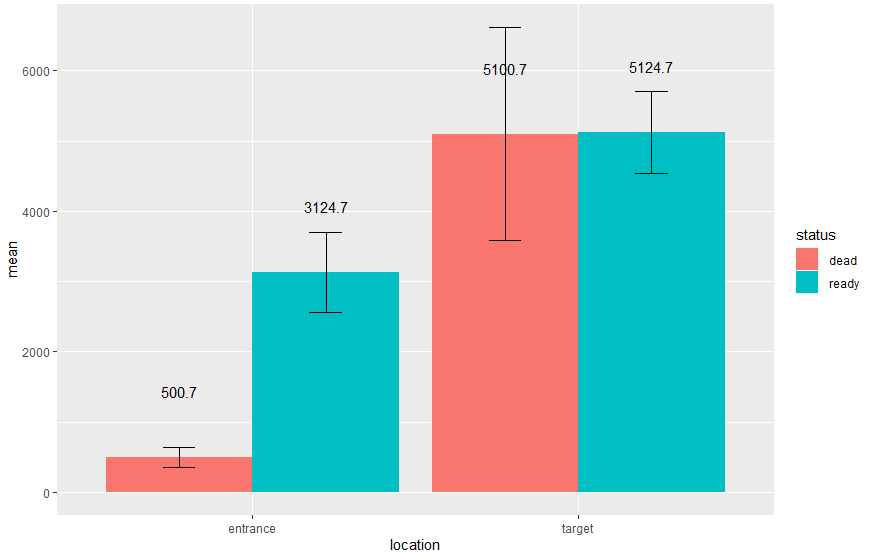
Some examples of the package in action follow.